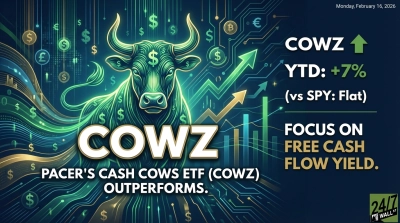
Pacer US Cash Cows 100 ETF (NYSEARCA:COWZ) owns the 100 Russell 1000 names that generate the most free cash flow relative to market value. That pitch has worked. COWZ trades around $64 and is up 17% over the past year. But the engine powering the fund depends on one variable holding up across cyclical sectors, and that variable is starting to wobble.
What “dogs” actually means here
In stock-picker shorthand, dogs are laggards. The original Dogs of the Dow strategy bought the ten highest-yielding Dow names every January on the theory that a fat dividend yield signaled a beaten-down price that would mean-revert. COWZ inverts the logic.
Instead of hunting cheap yield, it hunts cheap cash generation, screening the Russell 1000 for the highest trailing free-cash-flow yields and capping each name near 2% at quarterly rebalances. The expense ratio is 0.49%, which is steep for a rules-based screen, but the rules have produced real numbers: 63% over five years.
The screen is the strategy
Free cash flow is operating cash flow minus capex. Raise capex, and even a healthy operating business stops qualifying. When Energy and Industrials, two sectors that historically dominate the fund’s roster, start spending more to maintain production or build capacity, the screen quietly demotes them at the next rebalance. The current top holding are a mix of chip companies, mixed with industrials and well-established cash cows like Altria (NYSE:MO | MO Price Prediction).
Another holding, ConocoPhillips (NYSE:COP), shows how this can go sideways. Annual capex ran $5.3 billion in 2021, then climbed to $11.2 billion in 2023 and $12.1 billion in 2024. Operating cash flow stayed roughly flat, so implied free cash flow collapsed from $18.2 billion in 2022 to about $8 billion in 2023 and 2024.
The buyback program kept running at $5 billion to $9 billion annually through the squeeze, which is how a cash cow starts to look indistinguishable from a dog on a free-cash-flow-yield screen.
Pharma adds its own capex problem
The pharma sector is seeing rising expenses. And with The White House trying to lower drug prices, it could see lower profits too.
Pfizer’s (NYSE:PFE) capex jumped to $3.9 billion in 2023, well above its decade baseline near $2.5 billion. More worrying for a fund tilted toward cash returners: Pfizer paid $9.77 billion in dividends against $9.08 billion of free cash flow in 2025, a payout ratio of about 108%. Sustainable for a quarter or two, but not for a multi-year thesis.
What this means at the next rebalance
If Energy capex stays elevated and pharma payout ratios stay above 100%, the quarterly screen will rotate out of familiar names and into whatever sector generates the next wave of free cash. That rotation is the design working as intended. COWZ is supposed to chase the cash. But investors who bought it for the current roster, or who assume Energy will always be the engine, are not really buying what the rules deliver.
BEA data backs the broader squeeze. Transportation profits fell from $125.2 billion in Q1 2024 to $96.8 billion in Q4 2025, and utilities slipped from $66.5 billion to $54.9 billion. Capex-heavy sectors are giving back margin even as total corporate profits grew 12% year over year in Q1 2026.
Who should own it
COWZ fits an investor who wants a value tilt without deep-value drawdowns from pure book-value screens, and who accepts that holdings will look different a year from now. A 5% to 10% sleeve next to a broad index reflects how the fund’s rotating roster tends to be used in practice.
Anyone expecting the current Energy-heavy lineup to persist into 2027 is buying a snapshot of a fund that, by design, refuses to stand still. The Schwab U.S. Dividend Equity ETF (NYSEARCA:SCHD) covers similar quality-value ground at lower cost if you prefer dividend durability to free-cash-flow momentum.