




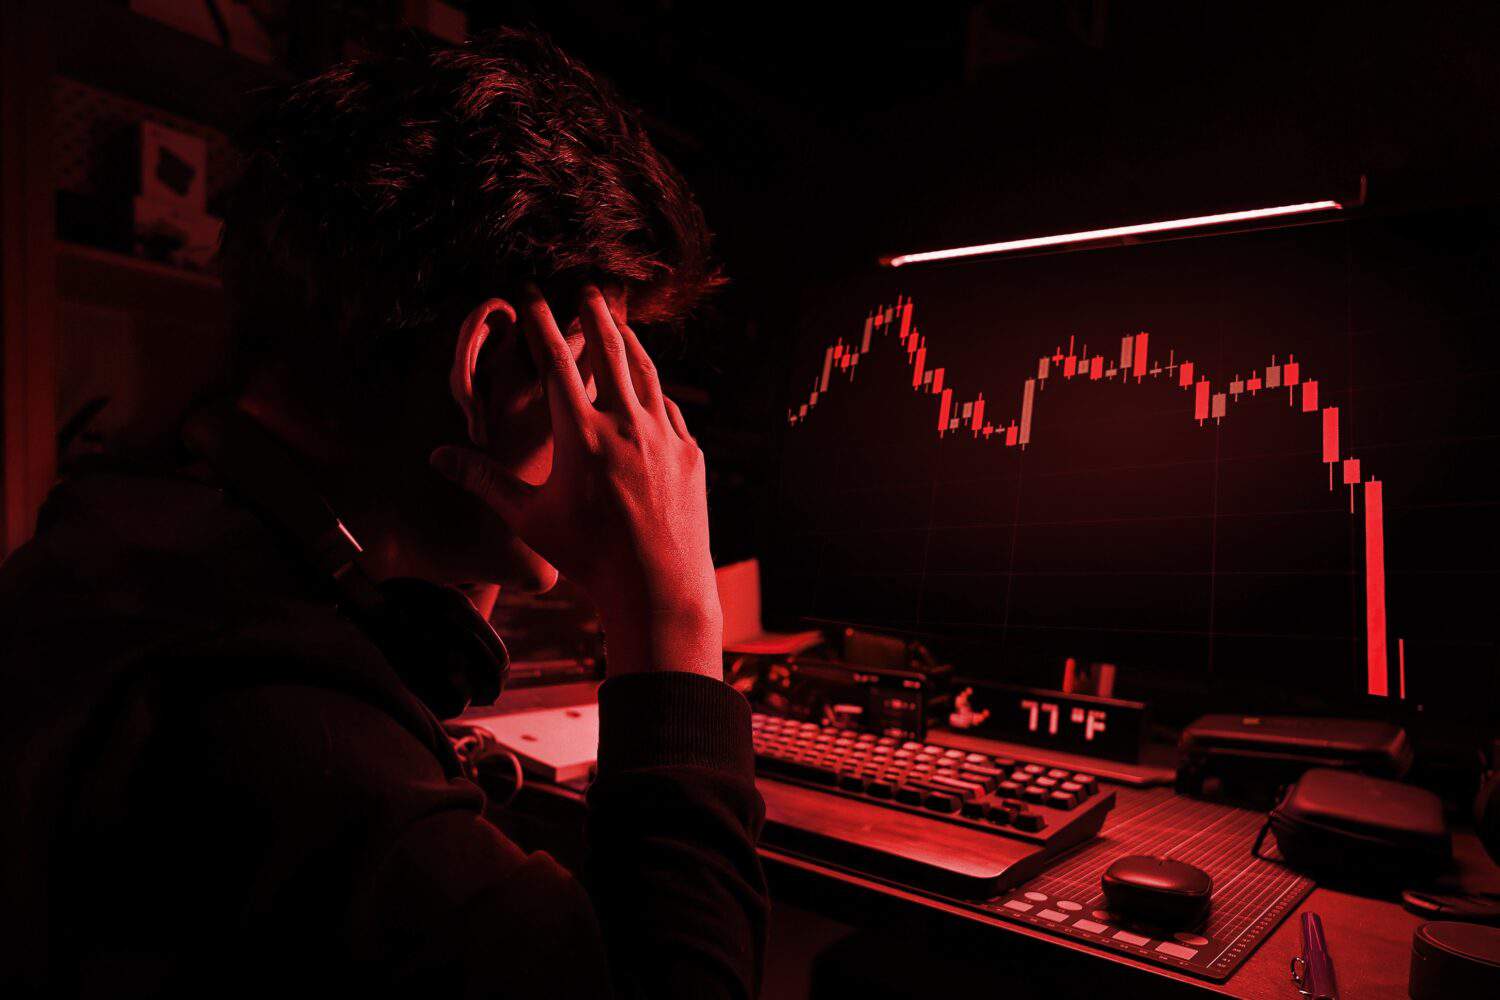
Jeremy Grantham, the co-founder and long-term investment strategist at GMO Asset Management, appeared on CNBC Squawk Box in late June with one of the bleakest market calls of his career. Grantham, who says GMO manages roughly $85 billion, called this “the most expensive market in American history” and warned that a reversion to long-term trend would be closer to a wipeout than a routine correction.
The eventual peak-to-trough decline, in Grantham’s view, is “closer to a 70% decline” than a 50% drop. He stresses that the timing of such a move is inherently uncertain, placing the window anywhere from roughly two weeks to two years. Readers should treat this as a thesis from a prominent bubble-caller with a long track record, not as a near-term market forecast.
Why Grantham Thinks Valuations Are Historically Stretched
Grantham’s valuation case rests on a long historical baseline. He argues the market’s price-to-earnings ratio has averaged more than 60% higher from 2010 to today than during the prior 100 years, a persistent premium he attributes in part to a prolonged stretch of unusually cheap money.
The rate backdrop has shifted considerably since that era of easy money ended. The federal funds rate target range stood at 3.5% to 3.75% after the Federal Open Market Committee held rates steady at its June 17, 2026 meeting. The 10-year Treasury yield has climbed to roughly 4.6% in mid-to-late July 2026, pushed higher by renewed inflation concerns tied to U.S.-Iran tensions and mounting federal debt. Meanwhile, the FOMC noted in its June statement that “inflation remains elevated relative to the Committee’s 2% goal,” and futures markets were pricing a meaningful probability of a rate increase by September.
The Two-Sigma Bubble Framework
Grantham anchors his bear case in what he calls a “two sigma” statistical framework. At GMO, he defines a bubble as a two-standard-deviation divergence of an asset class above its long-term real price trend. He says all 26 prior market bubbles that reached this threshold eventually fell back toward their historical mean, without a single exception.
His closest comparison is the dot-com peak. Grantham argues today’s setup most resembles 2000 but looks worse by the numbers. On his track record from that period, Grantham notes he called a 70 to 75% NASDAQ decline in 2000, and the index ultimately fell 82%. His broader record spans Japan’s 1989 crash, the dot-com bust, and the U.S. housing collapse before the 2007-2008 financial crisis.
Parallels Between AI, the Internet, and Railroads
Grantham is careful to separate his view on AI’s genuine importance from his view on market pricing. He acknowledges the technology is transformative, but argues that universal recognition of that fact has produced dangerous overinvestment. His go-to historical parallels are railroads and the internet: world-changing innovations that nonetheless produced severe crashes that, in his words, destroyed early investors first.
He made his view concrete when discussing the SpaceX IPO. Grantham pointed out that Amazon shares fell 92% after the dot-com bubble burst before the company eventually “inherited the earth.” He suggested SpaceX faces a similar risk, given what he described as a roughly $2 trillion valuation at the time of the IPO on a business still generating net losses. SpaceX’s stock had already fallen about 32% from its all-time high within days of its debut, a move Grantham framed as a textbook sign of late-bubble excess.
The Nasdaq-100 index returned around 16.6% year-to-date through late June 2026, and roughly 32% over the prior year. The S&P 500 posted a return of approximately 21% over the same trailing year, with a gain of roughly 548% from January 2010 through June 2026 — the era Grantham flags as anomalously expensive relative to the preceding century.
The Open Question of Timing
Whether Grantham is ultimately right remains an open question. His warning rests on the premise that markets have repeatedly returned to long-term valuation trends after periods of extreme optimism, even when the underlying technology proved revolutionary. His own long record lends the argument weight: he has issued prescient warnings before most investors expected trouble.
At the same time, markets can remain expensive for years before sentiment shifts. Grantham himself has acknowledged that timing is the hardest part of any bubble call, and he issued a comparably dire long-term warning in March 2024, after which stocks continued to advance. For readers who want primary sources, GMO publishes Grantham’s quarterly letters and bubble research at the firm’s research library.
Editor’s note: This update refreshes the 10-year Treasury yield to approximately 4.6% as of late July 2026, corrects the federal funds rate description to the confirmed 3.5% to 3.75% target range held at the June 17 FOMC meeting, and adds post-publication context on Grantham’s SpaceX commentary, including his comparison of the company to Amazon’s 92% post-dot-com decline and the stock’s 32% drop from its all-time high.
Contact [email protected] for any questions or corrections.









 Top Gaining Stocks
 Top Losing Stocks