




Meta Platforms (NASDAQ:META | META Price Prediction) and Pinterest (NYSE:PINS) both closed Q1 2026 with double-digit revenue growth, yet the businesses behind those beats look nothing alike.
Meta is pouring tens of billions into a superintelligence buildout that already reaches 3.56 billion daily users. Pinterest is a smaller visual discovery platform trying to turn 631 million monthly users into a durable ad engine.
AI Infrastructure Powers One. Visual Search Powers the Other.
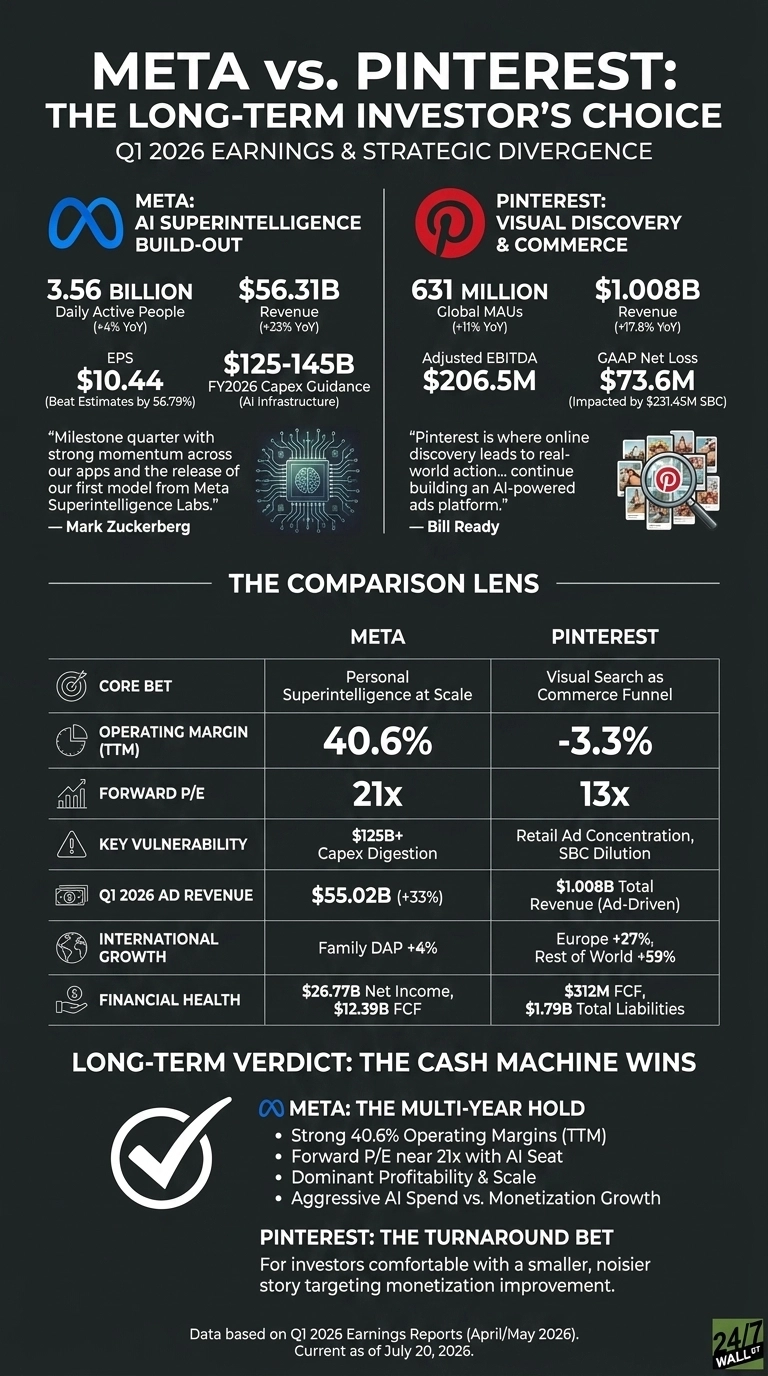
Meta beat Wall Street with EPS of $10.44 on $56.311 billion in revenue, up 33.08% year over year. Ad impressions climbed 19% while price per ad rose 12%, a rare combo that shows AI-driven targeting is still improving auction dynamics. A $8.03 billion tax benefit tied to U.S. Treasury Notice 2026-7 flattered the headline, so the underlying quarter looks strong but not quite as heroic as the headline suggests.
CEO Mark Zuckerberg framed it as “a milestone quarter with strong momentum across our apps and the release of our first model from Meta Superintelligence Labs.” Reality Labs still bleeds cash at a $4.03 billion operating loss, and capex guidance jumped to $125 to $145 billion for the year.

Pinterest posted $1.008 billion in revenue, up 17.84%, its first quarter above the billion-dollar mark. Rest of World revenue exploded 59% year over year, and Europe added 27%.
Bill Ready keeps hammering the same theme: “Pinterest is where online discovery leads to real-world action.” The catch is a GAAP net loss of $73.6 million, driven by $231.45 million in stock-based comp and a $47.1 million restructuring charge.

A Cash Machine Versus a Turnaround Bet
| Lens | Meta | |
| Core Bet | Personal superintelligence at scale | Visual search as commerce funnel |
| Operating Margin (TTM) | 40.6% | -3.3% |
| Forward P/E | 21x | 13x |
| Key Vulnerability | $125B+ capex digestion | Retail ad concentration, SBC dilution |
Meta is spending like a company chasing a decade-defining platform shift, and it can afford to. Return on equity sits at 32.9%.
Pinterest carries a leaner sheet after loading up on $980 million in convertible notes and completing $1.946 billion in Class A buybacks, which drained cash from $969M to $378 million. That is an aggressive move for a company still running at a GAAP loss.
The Next Twelve Months Will Decide Everything
For Meta, the question is whether ad monetization keeps outrunning capex. Polymarket traders assign a 92.5% probability Meta beats Q2, and analysts carry an average target of $822.69 against a recent price of $644.12.
For Pinterest, I want to see ARPU accelerate beyond the current $1.61 and evidence the AI ads platform actually closes the monetization gap versus larger peers.
Why I Lean Toward Meta for the Long Haul
If I have to pick one for a multi-year hold, I take Meta. The combination of 40.6% operating margins, a forward P/E near 21x, and a genuine seat at the superintelligence table is difficult to replicate.
Pinterest fits a different investor: someone comfortable with a smaller, noisier turnaround story where shares have already recovered 11.27% since the May 4 earnings report. I would revisit that view if capex creeps above $145B without matching ad growth, or if Pinterest finally translates its 27% European and 59% Rest of World growth into positive GAAP earnings. Until then, the cash machine wins.
Contact [email protected] for any questions or corrections.













 Top Gaining Stocks
 Top Losing Stocks